Measurement Details
The Measurement section in the DOODIN app provides detailed information about plot geometry, including shape, slopes, and contour data. Below are the key sections included in the measurement details:

Navigation
Use the segmented control at the top of the modal to switch between three tabs:
- Shape
- Slopes
- Contour
Shape Tab
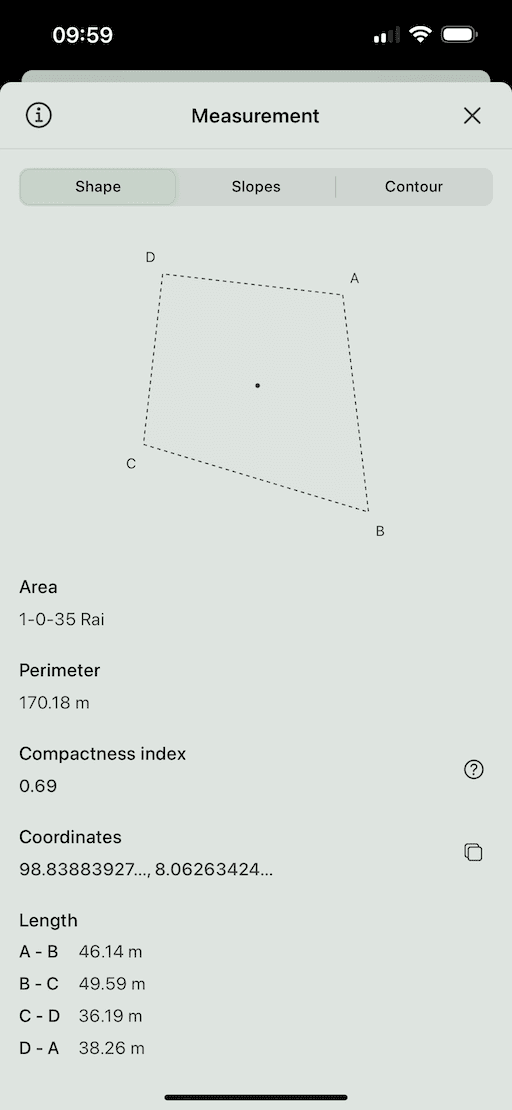
In the Shape tab, you will find the following details:
- Polygon Vector: Displays the geometry of the plot, including boundary lines and centroid (central point). Labels each point on the boundary for easy reference.
- Area and Perimeter:
- Area: Displays the size of the plot in the selected unit of measurement (modifiable in the Settings Page).
- Perimeter: Shows the total length of the plot's boundary.
- Compactness: Indicates the compactness of the plot, which helps in understanding how square-shaped or stretched the plot is. A higher value generally indicates a more compact (square-like) plot. The highest possible value is 1 (ideal).
- Coordinates: Provides the geographic coordinates (latitude and longitude) of the plot’s centroid.
- Distances: Displays distances between all points on the boundary of the plot. These are the length of all sides in the selected unit of measurement (modifiable in the Settings Page).
Slopes Tab

In the Slopes tab, you will find:
-
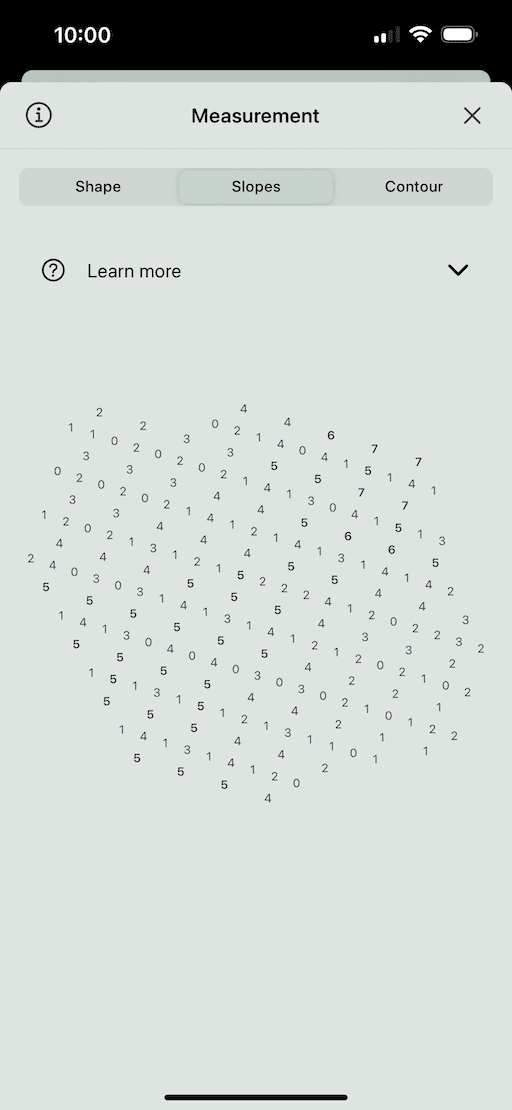
Polygon Slopes: Provides information on the slope of the plot, which can be useful for construction, farming, and drainage planning. The slopes are visualized to show incline or decline across the plot.
More Info:
Slopes provide a visual representation of the terrain's incline or steepness on a map. This tool helps to understand the topography of a given area by indicating the rates at which the ground rises or falls. Here’s how to interpret the slope graphic:
-
Categories:
- Gentle Slopes: Typically represented with lighter colors, indicating areas with minimal elevation change.
- Moderate Slopes: Displayed with medium intensity colors, representing moderate incline or decline.
- Steep Slopes: Shown with darker colors, these areas have the most significant changes in elevation.
-
Slope values:
- Each number indicates the exact angle or grade in degrees of the slope.
- Labels help you easily identify and quantify the steepness of the terrain.
-
Contour Tab

In the Contour tab, you will find:
-
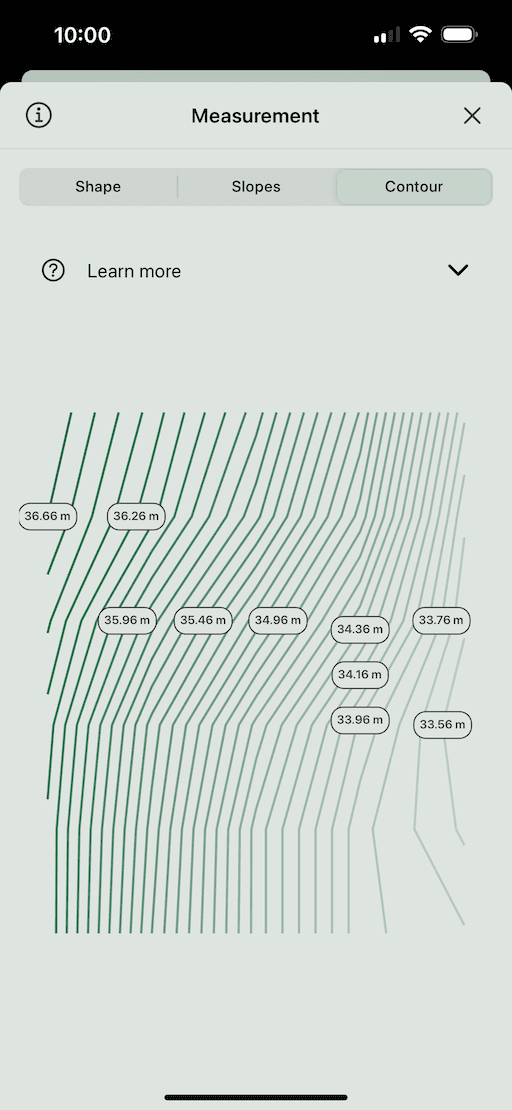
Polygon Contour: Displays contour information that helps in understanding the elevation profile of the plot. The contours show different elevation levels, allowing you to visualize terrain variations.
More Info:
Contour Lines represent points of equal elevation on a map, providing a visual guide to the terrain's shape and elevation changes. Here’s how to interpret the contour lines:
-
Elevation Representation:
- Contour lines connect points that have the same elevation.
- The spacing between the lines indicates the slope of the terrain. Closely spaced lines mean a steep slope, while widely spaced lines indicate a gentle slope.
-
Circles Indicating Hills:
- When the innermost contour circles have the highest elevation, and outer circles decrease in elevation, this pattern indicates a hill or mountain.
- Example: 🟢🟢🟢 (highest) ➞ ⚫⚫⚫ (lower).
-
Circles Indicating Depressions:
- When the innermost contour circles have the lowest elevation, and outer circles increase in elevation, this pattern indicates a depression such as a basin or crater.
- Example: ⚫⚫⚫ (lowest) ➞ 🟢🟢🟢 (higher).
- Depressions are often marked with hachure lines (short lines on the inside of the circle).
-
Elevation Values:
- Each contour line may be marked with its elevation value, helping you visualize and understand the terrain’s height changes.
-
For more information, visit the Overview section.